Monitor Your Uptime From Claude, in Plain English
By Lucian, founder of Monitive
Most uptime tools assume you will log into a dashboard, click around, fill in a form, and set up an alert. That is fine, until you are three terminals deep shipping a feature and the last thing you want is another browser tab.
So we built UptimeMonitoring to work the other way around. It speaks API first, and it ships an MCP server. If you already live inside Claude, Cursor, or any MCP-aware tool, you can create and check monitors by just asking, in plain English. No dashboard required.
Here is how to set it up, and what you can do once it is connected.
Connect it to Claude in one command
Add the server to Claude Code:
claude mcp add --transport http uptimemonitoring https://api.uptimemonitoring.com/mcpRun /mcp — it opens your browser to authorize via GitHub (sign-up is a GitHub login, no email, more on that below) and stores the access token automatically, no key needed. You should see uptimemonitoring with a green status.
For CI or headless setups, add --header "Authorization: Bearer umk_live_xxxxxxxxxxxxxxxxxxxxxxxxxxxxxxxx" to the claude mcp add command instead, using a key from your API keys page.
On Cursor it is a small mcp.json instead:
{ "mcpServers": { "uptimemonitoring": { "url": "https://api.uptimemonitoring.com/mcp", "headers": { "Authorization": "Bearer umk_live_xxxxxxxxxxxxxxxxxxxxxxxxxxxxxxxx" } } }}Now just talk to it
Once it is connected, you skip the forms entirely. A few things you can say:
List my monitorsCreate an HTTP monitor for https://example.com named "Marketing site"What is the current status of monitor 123?Run a test on monitor 123 right nowBehind those sentences are real tools the agent calls: listing and reading monitors, creating, updating, and deleting them, pulling your recent incidents, checking your account, and one we are particularly fond of, assert_monitor_healthy.
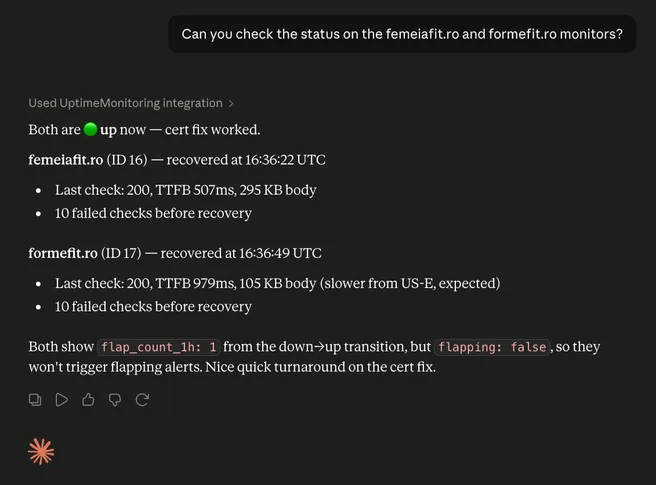 A real exchange. Ask in plain English, Claude calls the tools and answers.
The one that earns its keep: assert_monitor_healthy
assert_monitor_healthy does exactly what it says. It returns success only if a monitor is currently up, which makes it a clean health gate for a deploy pipeline. Ship your code, then have your agent (or a GitHub Action) assert the thing is actually serving traffic before you call the deploy done. If it is down, the step fails, and you know before your users do.
That is the whole idea: monitoring that a script or an agent can consume, not just a human squinting at a chart.
What it does not do on purpose
We would rather be honest than oversell. The free tier covers 50 monitors, which is genuinely generous because of how we store data (incidents and lightweight evidence, not a full time-series database). But if you need status pages, SMS or voice alerts, SLA reports, or team seats, those live in Monitive, the 15-year-old product this is built by. UptimeMonitoring is the developer-and-agent-shaped front door; Monitive is where the human and team features live.
Also worth knowing: there is no email anywhere in the system. We collect a GitHub identity and nothing else. Alerts come out as webhooks, an MCP pull, or an RSS feed, not an inbox you have to babysit. Less data we hold means less risk for you, and no deliverability headaches for us.
Why this matters
Monitoring has been a dashboard product for twenty years. But more and more of the work now happens in pipelines and in agents. Letting Claude create a monitor while you are mid-conversation, or letting CI assert health on every deploy, is not a gimmick. It is monitoring meeting you where you already work.
Connect it once, then forget the dashboard exists.
Start free with your GitHub login. 50 monitors, no email required. Get your API key and add the MCP server in under a minute.
New here? Here is the story of why we built this.